Tables and Charts
View your report/template's tables and charts two different ways:
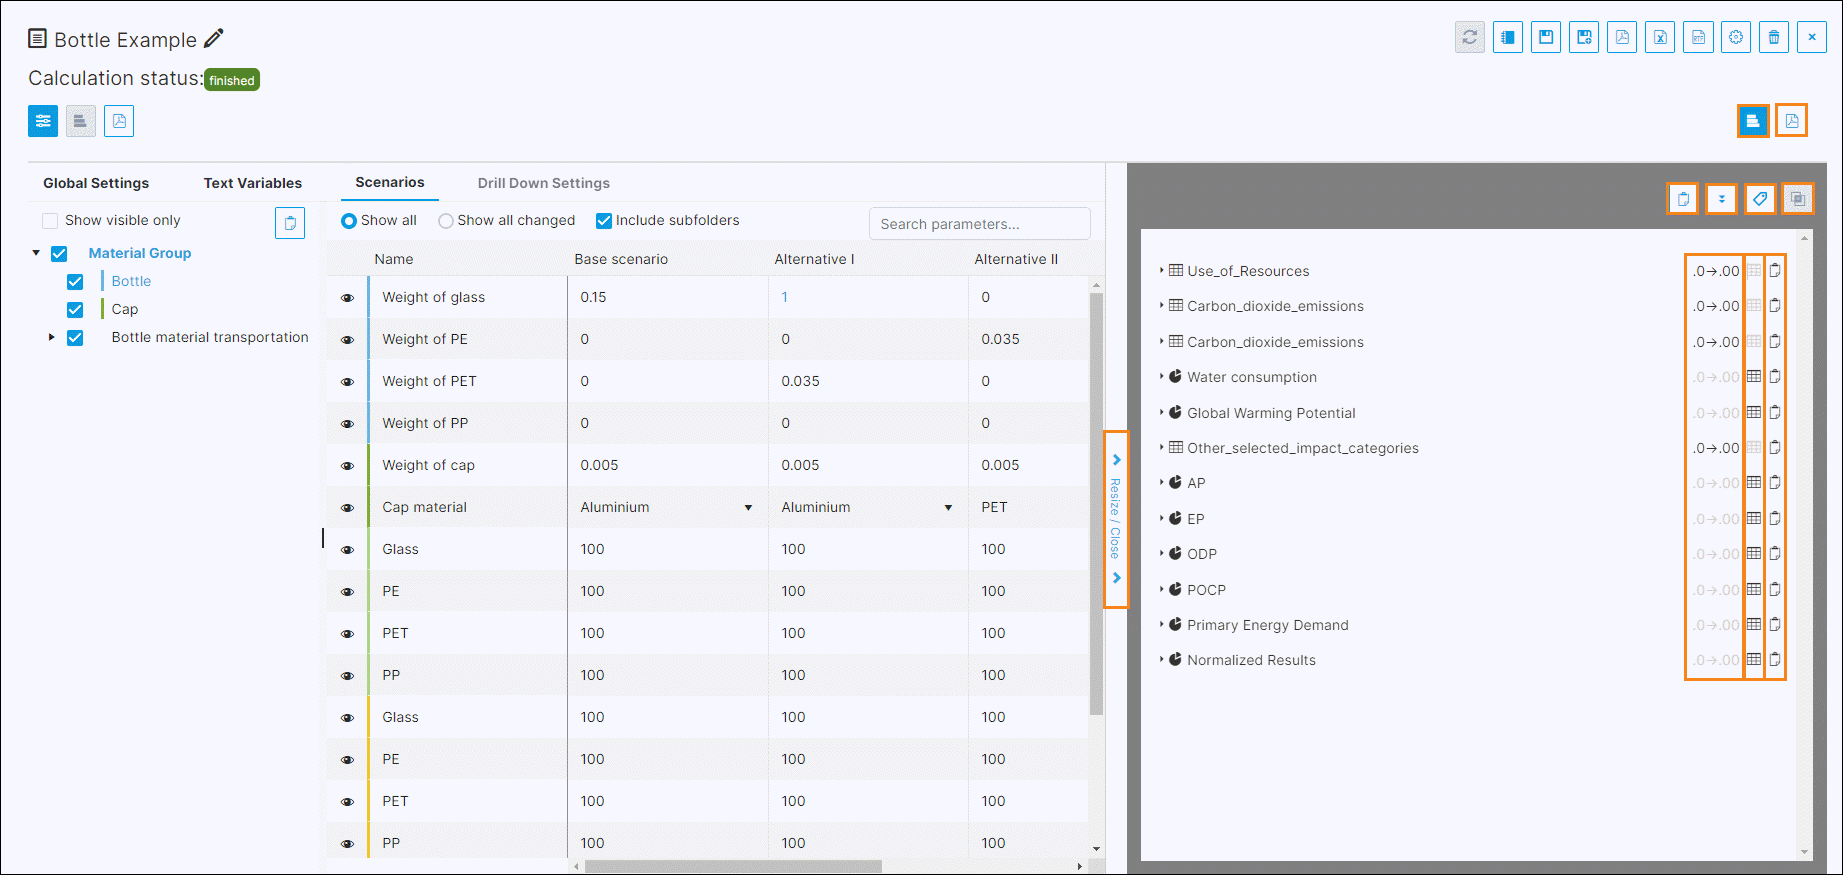
Click the Slide In bar and reveal them beside the parameters
Click the image below to learn more.
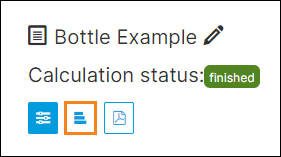
Click the Tables and Charts button shown below.
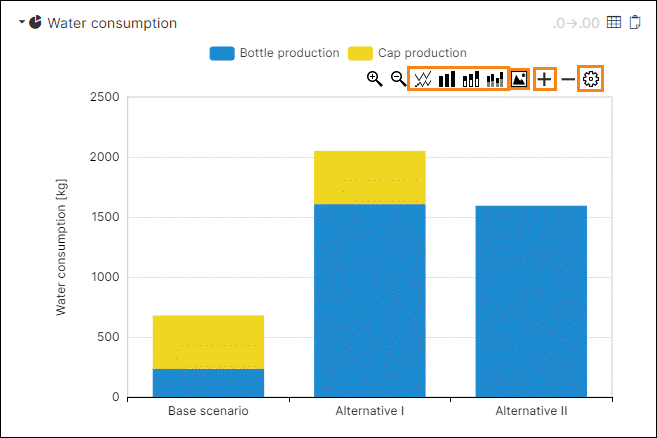
Charts can be:
Shown as a different type of chart
Saved as an image
Enlarged
Configured
Click the image below to learn more.